artprima / prometheus-metrics-bundle
Symfony 5.4/6.4/7.4/8.x Prometheus Metrics Bundle
Package info
github.com/artprima/prometheus-metrics-bundle
Type:symfony-bundle
pkg:composer/artprima/prometheus-metrics-bundle
Requires
- php: ^8.1
- ext-json: *
- promphp/prometheus_client_php: ^2.6
- symfony/config: ^5.4|^6.4|^7.2|^8.0
- symfony/dependency-injection: ^5.4|^6.4|^7.2|^8.0
- symfony/http-kernel: ^5.4|^6.4|^7.2|^8.0
Requires (Dev)
- ext-apcu: *
- ext-redis: *
- escapestudios/symfony2-coding-standard: ^3.11
- friendsofphp/php-cs-fixer: ^3.75
- phpunit/phpunit: ^10.0
- squizlabs/php_codesniffer: ^3.5
- symfony/browser-kit: ^5.4|^6.4|^7.2|^8.0
- symfony/framework-bundle: ^5.4|^6.4|^7.2|^8.0
- symfony/yaml: ^5.4|^6.4|^7.2|^8.0
Suggests
- ext-apcu: Required if using APCu as prometheus metrics backend
- ext-redis: Required if using Redis as prometheus metrics backend
- symfony/stopwatch: Required if you want to measure request duration
README
| Master |
|---|
Symfony 5.4/6.4/7.4/8.x Prometheus Metrics Bundle
A Symfony bundle for the promphp/prometheus_client_php.
Supported Versions
The bundle is currently maintained against these versions:
- PHP: 8.2, 8.3, 8.4, 8.5
- Symfony: 5.4, 6.4, 7.4, 8.x
Compatibility policy:
- Symfony 5.4 is kept for legacy/LTS compatibility.
- Symfony 8.x requires PHP 8.4 or newer.
- CI covers the supported boundaries instead of testing the full Cartesian product of every PHP/Symfony combination.
Installation
Applications that use Symfony Flex
Open a command console, enter your project directory and execute:
composer require artprima/prometheus-metrics-bundle
Applications that don't use Symfony Flex
Step 1: Download the Bundle
Open a command console, enter your project directory and execute the following command to download the latest stable version of this bundle:
composer require artprima/prometheus-metrics-bundle
This command requires you to have Composer installed globally, as explained in the installation chapter of the Composer documentation.
Step 2: Enable the Bundle
Then, enable the bundle by adding it to the list of registered bundles
in the app/AppKernel.php file of your project:
<?php
// app/AppKernel.php

// ...
class AppKernel extends Kernel
{
    public function registerBundles()
    {
        $bundles = [
            // ...
            new Artprima\PrometheusMetricsBundle\ArtprimaPrometheusMetricsBundle(),
        ];

        // ...
    }

    // ...
}
Configuration
config.yaml
artprima_prometheus_metrics:
    # namespace is used to prefix the prometheus metrics
    namespace: myapp

    # ignoring some routes in metrics
    ignored_routes: [some_route_name, another_route_name]

    # Custom labels that can be added along the "action" label.
    # You can set up for example:
    # http_2xx_responses_total{action="GET-app_dummy_homepage",color="red",client_name="mobile-app"}
    labels:
        - name: "color"
          type: "request_attribute"
          value: "_color"   # Create a subscriber and set up the `_color` attribute in the request. See example below.
        - name: "client_name"
          type: "request_header" # Create a subscriber and set up the `X-Client-Name` header in the request. See example below.
          value: "X-Client-Name"

    # Custom buckets for the request duration histogram.
    # Buckets must be unique and strictly increasing. Omit this option to use the Prometheus client defaults.
    buckets: [0.1, 0.3, 1.0, 3.0]

    # metrics backend
    storage:
        # DSN of the storage. All parsed values will override explicitly set parameters. Ex: redis://127.0.0.1?timeout=0.1
        url: ~

        # Known values: in_memory, apcu, apcng, redis
        type: in_memory

        # Available parameters used by redis
        host: 127.0.0.1
        port: 6379
        timeout: 0.1
        read_timeout: 10
        persistent_connections: false
        password: ~
        database: ~ # Int value used by redis adapter
        prefix: ~   # String value used by redis and apcu

        # A variable parameter to define additional options as key / value.
        options:
            foo: bar

    # used to disable default application metrics
    disable_default_metrics: false

    # used to disable default metrics from promphp/prometheus_client_php
    disable_default_promphp_metrics: false

    # used to enable console metrics
    enable_console_metrics: false
Supported types are:
| Adapter name | Prometheus class |
|---|---|
| in_memory | Prometheus\Storage\InMemory |
| apcu | Prometheus\Storage\APC |
| apcng | Prometheus\Storage\APCng |
| redis | Prometheus\Storage\Redis |
routes.yaml
# expose /metrics/prometheus in your application
app_metrics:
    resource: '@ArtprimaPrometheusMetricsBundle/Resources/config/routing.yaml'
You can alternatively define your own path and rules:
app_metrics:
    path: /mypath/mymetrics
    controller: Artprima\PrometheusMetricsBundle\Controller\MetricsController::prometheus
Now your metrics are available to Prometheus using http://<yourapp_url>/metrics/prometheus.
Custom Metrics Collector
If you want to collect your own metrics, you should create a class that will implement one or several interfaces that are
the children of the Artprima\PrometheusMetricsBundle\Metrics\MetricsCollectorInterface.
<?php

declare(strict_types=1);

namespace App\Metrics;

use Artprima\PrometheusMetricsBundle\Metrics\RequestMetricsCollectorInterface;
use Artprima\PrometheusMetricsBundle\Metrics\ResponseMetricsCollectorInterface;
use Prometheus\CollectorRegistry;
use Symfony\Component\HttpKernel\Event\RequestEvent;
use Symfony\Component\HttpKernel\Event\ResponseEvent;

/**
 * Class MyMetricsCollector.
 */
class MyMetricsCollector implements RequestMetricsCollectorInterface, ResponseMetricsCollectorInterface
{
    /**
     * @var string
     */
    private $namespace;

    /**
     * @var CollectorRegistry
     */
    private $collectionRegistry;

    public function init(string $namespace, CollectorRegistry $collectionRegistry): void
    {
        $this->namespace = $namespace;
        $this->collectionRegistry = $collectionRegistry;
    }

    private function incRequestsTotal(?string $method = null, ?string $route = null): void
    {
        $counter = $this->collectionRegistry->getOrRegisterCounter(
            $this->namespace,
            'http_requests_total',
            'total request count',
            ['action']
        );

        $counter->inc(['all']);

        if (null !== $method && null !== $route) {
            $counter->inc([sprintf('%s-%s', $method, $route)]);
        }
    }

    private function incResponsesTotal(?string $method = null, ?string $route = null): void
    {
        $counter = $this->collectionRegistry->getOrRegisterCounter(
            $this->namespace,
            'http_responses_total',
            'total response count',
            ['action']
        );
        $counter->inc(['all']);

        if (null !== $method && null !== $route) {
            $counter->inc([sprintf('%s-%s', $method, $route)]);
        }
    }

    // called on the `kernel.request` event
    public function collectRequest(RequestEvent $event): void
    {
        $request = $event->getRequest();
        $requestMethod = $request->getMethod();
        $requestRoute = $request->attributes->get('_route');

        // do not track "OPTIONS" requests
        if ('OPTIONS' === $requestMethod) {
            return;
        }

        $this->incRequestsTotal($requestMethod, $requestRoute);
    }

    // called on the `kernel.response` event
    public function collectResponse(ResponseEvent $event): void
    {
        $response = $event->getResponse();
        $request = $event->getRequest();

        $requestMethod = $request->getMethod();
        $requestRoute = $request->attributes->get('_route');

        $this->incResponsesTotal($requestMethod, $requestRoute);
    }
}
When using autoconfigure = true, by implementing Artprima\PrometheusMetricsBundle\Metrics\MetricsCollectorInterface
Symfony will automatically configure your metrics collector to be used by the collector registry.
By implementing one of the following interfaces you can collect the metrics on one of the listed Symfony kernel events:
Artprima\PrometheusMetricsBundle\Metrics\PreRequestMetricsCollectorInterface- collect metrics on "kernel.request" event with a priority of 1024.
Artprima\PrometheusMetricsBundle\Metrics\RequestMetricsCollectorInterface- collect metrics on "kernel.request" event (default priority).
Artprima\PrometheusMetricsBundle\Metrics\PreExceptionMetricsCollectorInterface- collect metrics on "kernel.exception" event with a priority of 1024.
Artprima\PrometheusMetricsBundle\Metrics\ExceptionMetricsCollectorInterface- collect metrics on "kernel.exception" event with (default priority).
Artprima\PrometheusMetricsBundle\Metrics\ResponseMetricsCollectorInterface- collect metrics on "kernel.response" event.
The following collectors will only work if you define enable_console_metrics: true in the bundle configuration:
Artprima\PrometheusMetricsBundle\Metrics\ConsoleCommandMetricsCollectorInterface- collect metrics on "console.command" event.
Artprima\PrometheusMetricsBundle\Metrics\ConsoleTerminateMetricsCollectorInterface- collect metrics on "console.terminate" event.
Artprima\PrometheusMetricsBundle\Metrics\ConsoleErrorMetricsCollectorInterface- collect metrics on "console.error" event.
For advanced usage you can implement Artprima\PrometheusMetricsBundle\Metrics\MetricsCollectorInterface directly.
There is also Artprima\PrometheusMetricsBundle\Metrics\MetricsCollectorInitTrait will add the init method to your
collector.
If you don't use autoconfigure = true, then you will have to add this to your services.yaml:
    App\Metrics\MyMetricsCollector:
        tags:
            - { name: prometheus_metrics_bundle.metrics_collector }
Custom Storage Adapter Factory
A storage adapter is an instance of Prometheus\Storage\Adapter.
To create your own storage adapter you should create a custom factory implementing Artprima\PrometheusMetricsBundle\StorageFactory\StorageFactoryInterface.
<?php

declare(strict_types=1);

namespace App\Metrics;

use Artprima\PrometheusMetricsBundle\StorageFactory\StorageFactoryInterface;
use Prometheus\Storage\Adapter;

class DummyFactory implements StorageFactoryInterface
{
    public function getName(): string
    {
        return 'dummy';
    }

    public function create(array $options): Adapter
    {
        return new Dummy($options);
    }
}
Symfony will automatically configure your storage factory with autoconfigure = true and implementing Artprima\PrometheusMetricsBundle\StorageFactory\StorageFactoryInterface.
If you don't use autoconfigure = true, then you will have to add this to your services.yaml:
    App\Metrics\DummyFactory:
        tags:
            - { name: prometheus_metrics_bundle.adapter_factory }
Custom Labels
Set up your custom labels by attaching an attribute or a header in the request. For example, given the following configuration:
artprima_prometheus_metrics:
    # ...
    labels:
        - name: "color"
          type: "request_attribute"
          value: "_color"
And configuring your subscriber like this:
<?php

declare(strict_types=1);

namespace MyApp;

use Symfony\Component\EventDispatcher\EventSubscriberInterface;

class RequestSubscriber implements EventSubscriberInterface
{
    public function onKernelRequest(RequestEvent $event): void
    {
        $request = $event->getRequest();
        $request->attributes->set('_color', 'red');
    }

    public static function getSubscribedEvents(): array
    {
        return [
            KernelEvents::REQUEST => 'onKernelRequest',
        ];
    }
}
Requests will be tracked with the color label:
http_2xx_responses_total{action="GET-app_dummy_homepage",color="red"}
http_2xx_responses_total{action="GET-all",color=""}
Default Metrics
These are default metrics exported by the application:
# TYPE php_info gauge
php_info{version="7.3.25-1+ubuntu18.04.1+deb.sury.org+1"} 1
# HELP symfony_http_2xx_responses_total total 2xx response count
# TYPE symfony_http_2xx_responses_total counter
symfony_http_2xx_responses_total{action="GET-app_dummy_homepage"} 1
symfony_http_2xx_responses_total{action="all"} 1
# HELP symfony_http_requests_total total request count
# TYPE symfony_http_requests_total counter
symfony_http_requests_total{action="GET-app_dummy_homepage"} 1
symfony_http_requests_total{action="all"} 1
# HELP symfony_instance_name app instance name
# TYPE symfony_instance_name gauge
symfony_instance_name{instance="dev"} 1
Note that, php_info comes from the underlying library promphp/prometheus_client_php. Other metrics are gathered
by the built-in class Artprima\PrometheusMetricsBundle\Metrics. Here, in the example we have a prefix symfony
and the metrics show a single request to the root named app_dummy_homepage. Symfony instance is named dev here.
Instance name comes from the server var HOSTNAME ($request->server->get('HOSTNAME')) and defaults to dev.
Override metric format
You can customize the way metrics are recorded in storage by implementing Artprima\PrometheusMetricsBundle\Metrics\MetricInfoResolverInterface.
Register your custom resolver in services.yaml with the tag:
    App\Metrics\MyMetricInfoResolver:
        tags:
            - { name: prometheus_metrics_bundle.metric_info_resolver }
Clear Metrics
The bundle provides a console command to clear metrics from the storage. Simply run:
./bin/console artprima:prometheus:metrics:clear
Grafana Dashboards
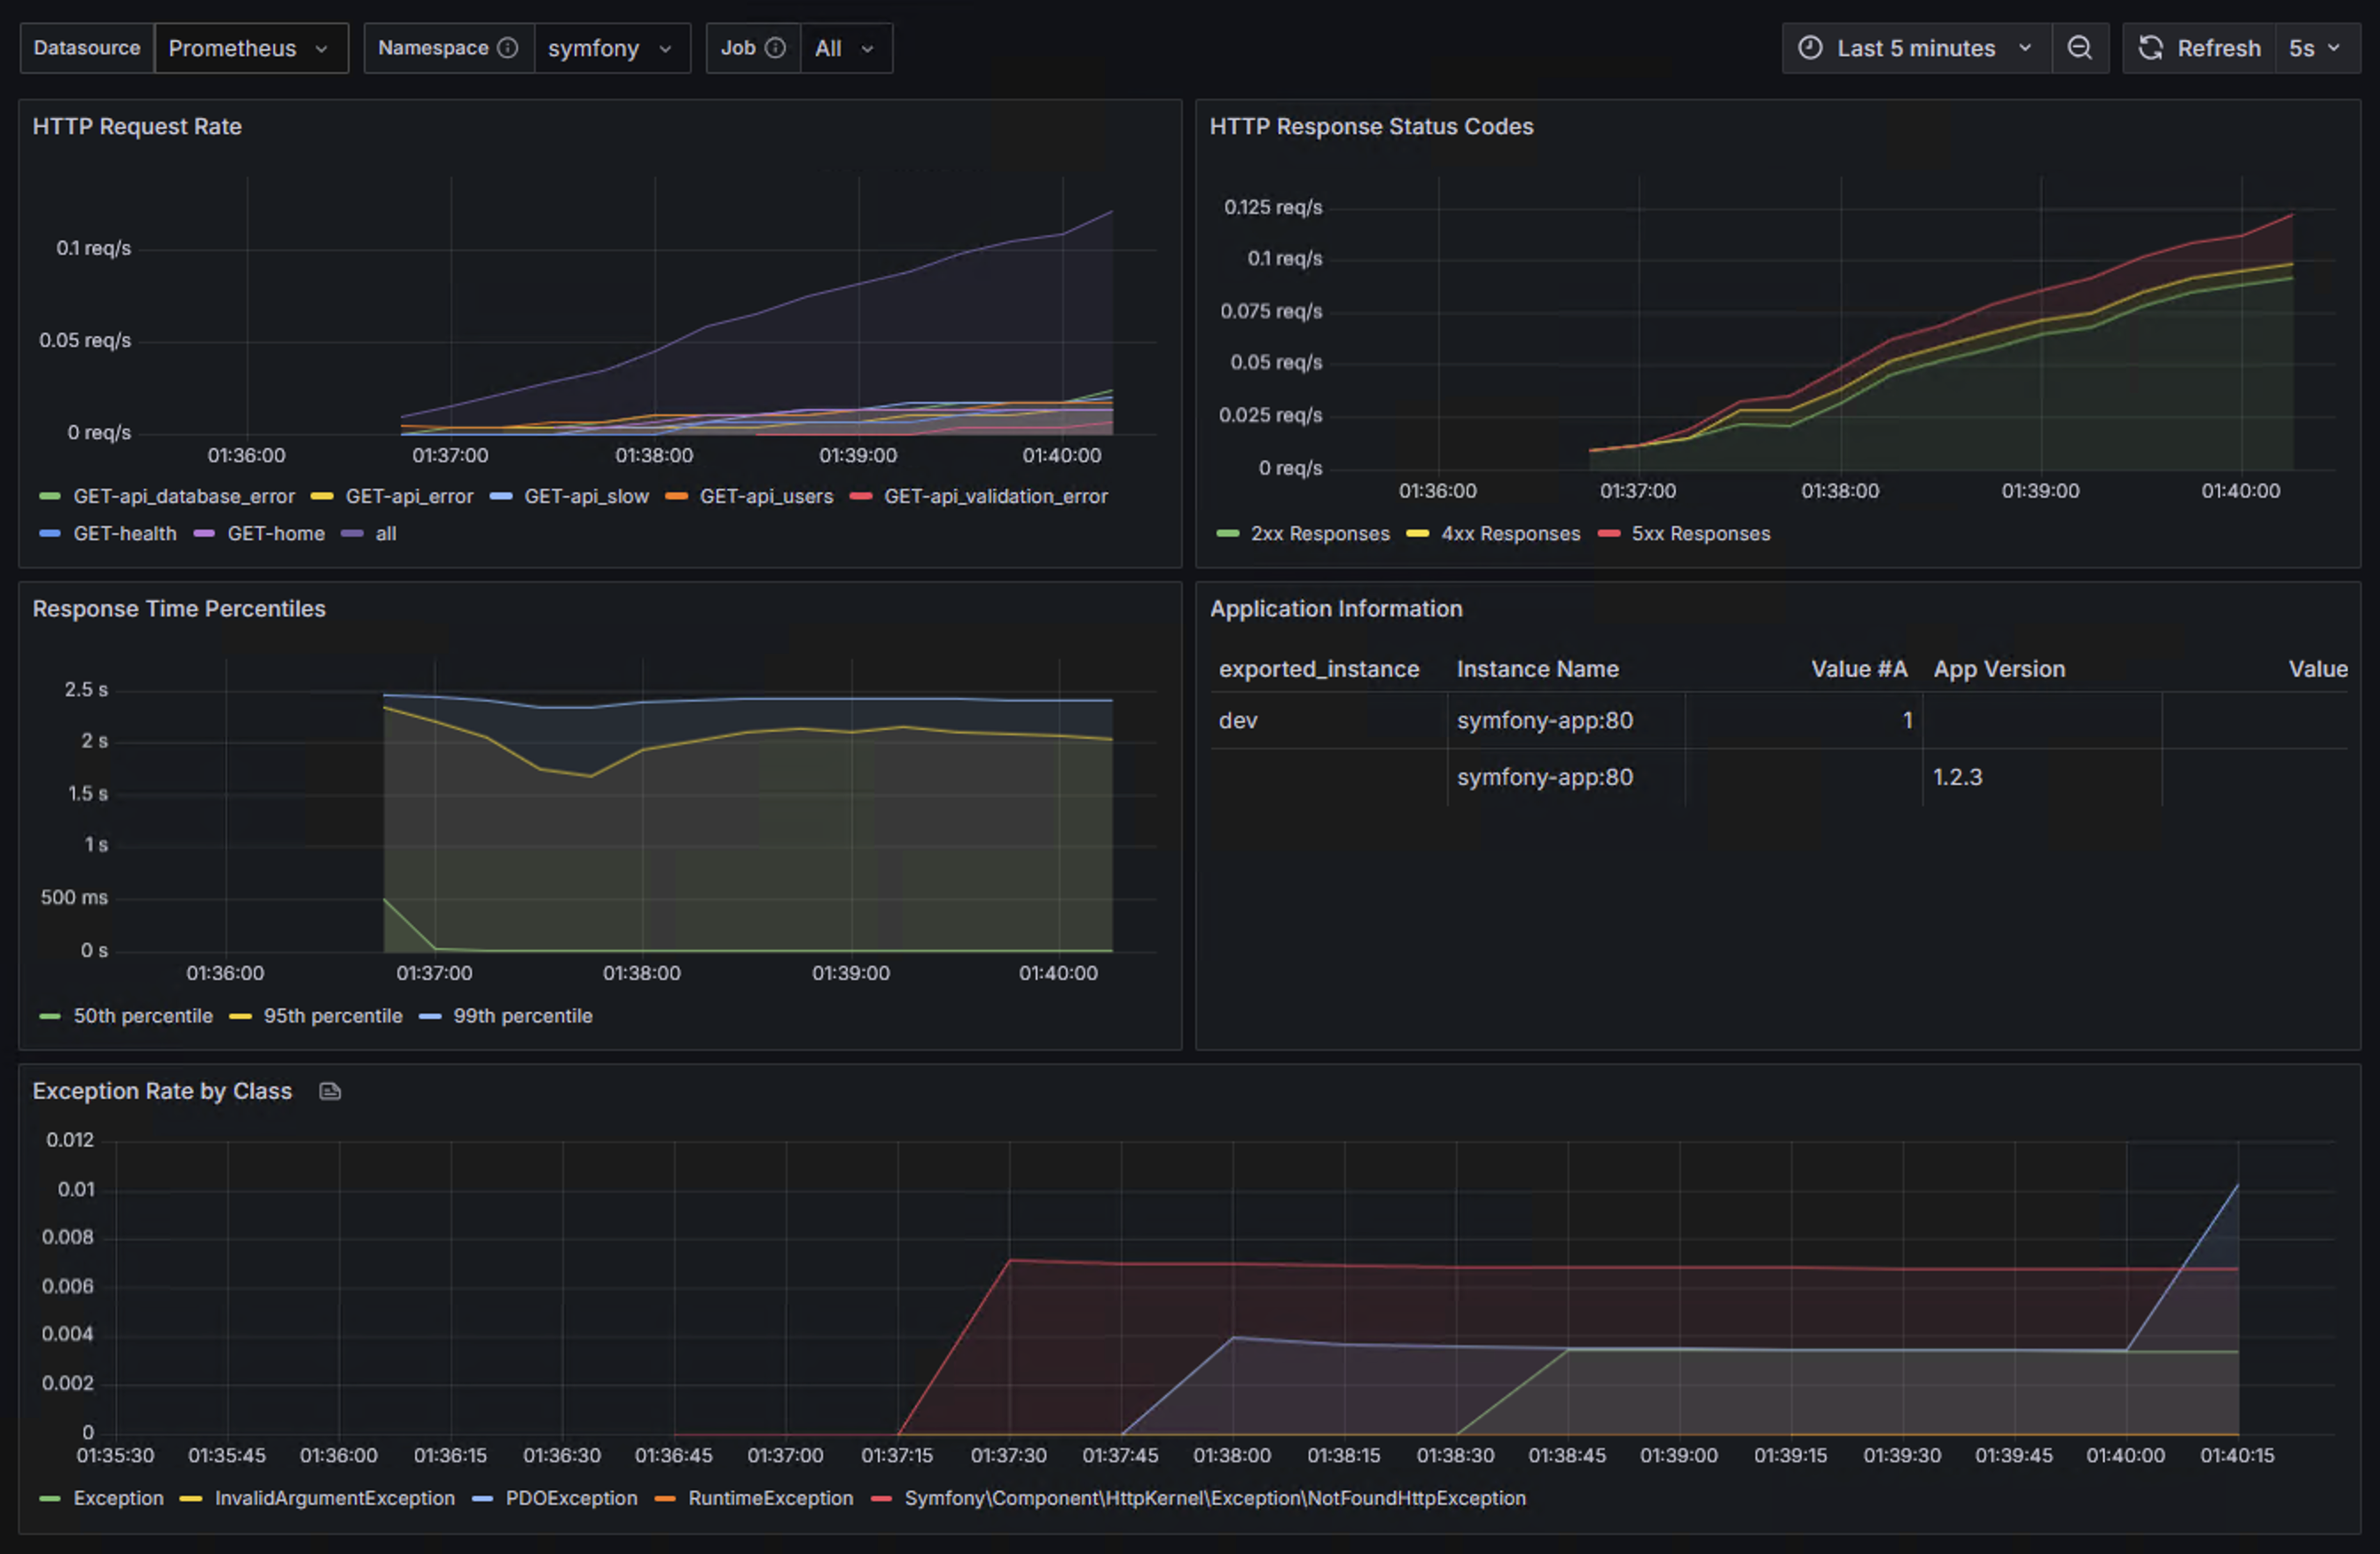
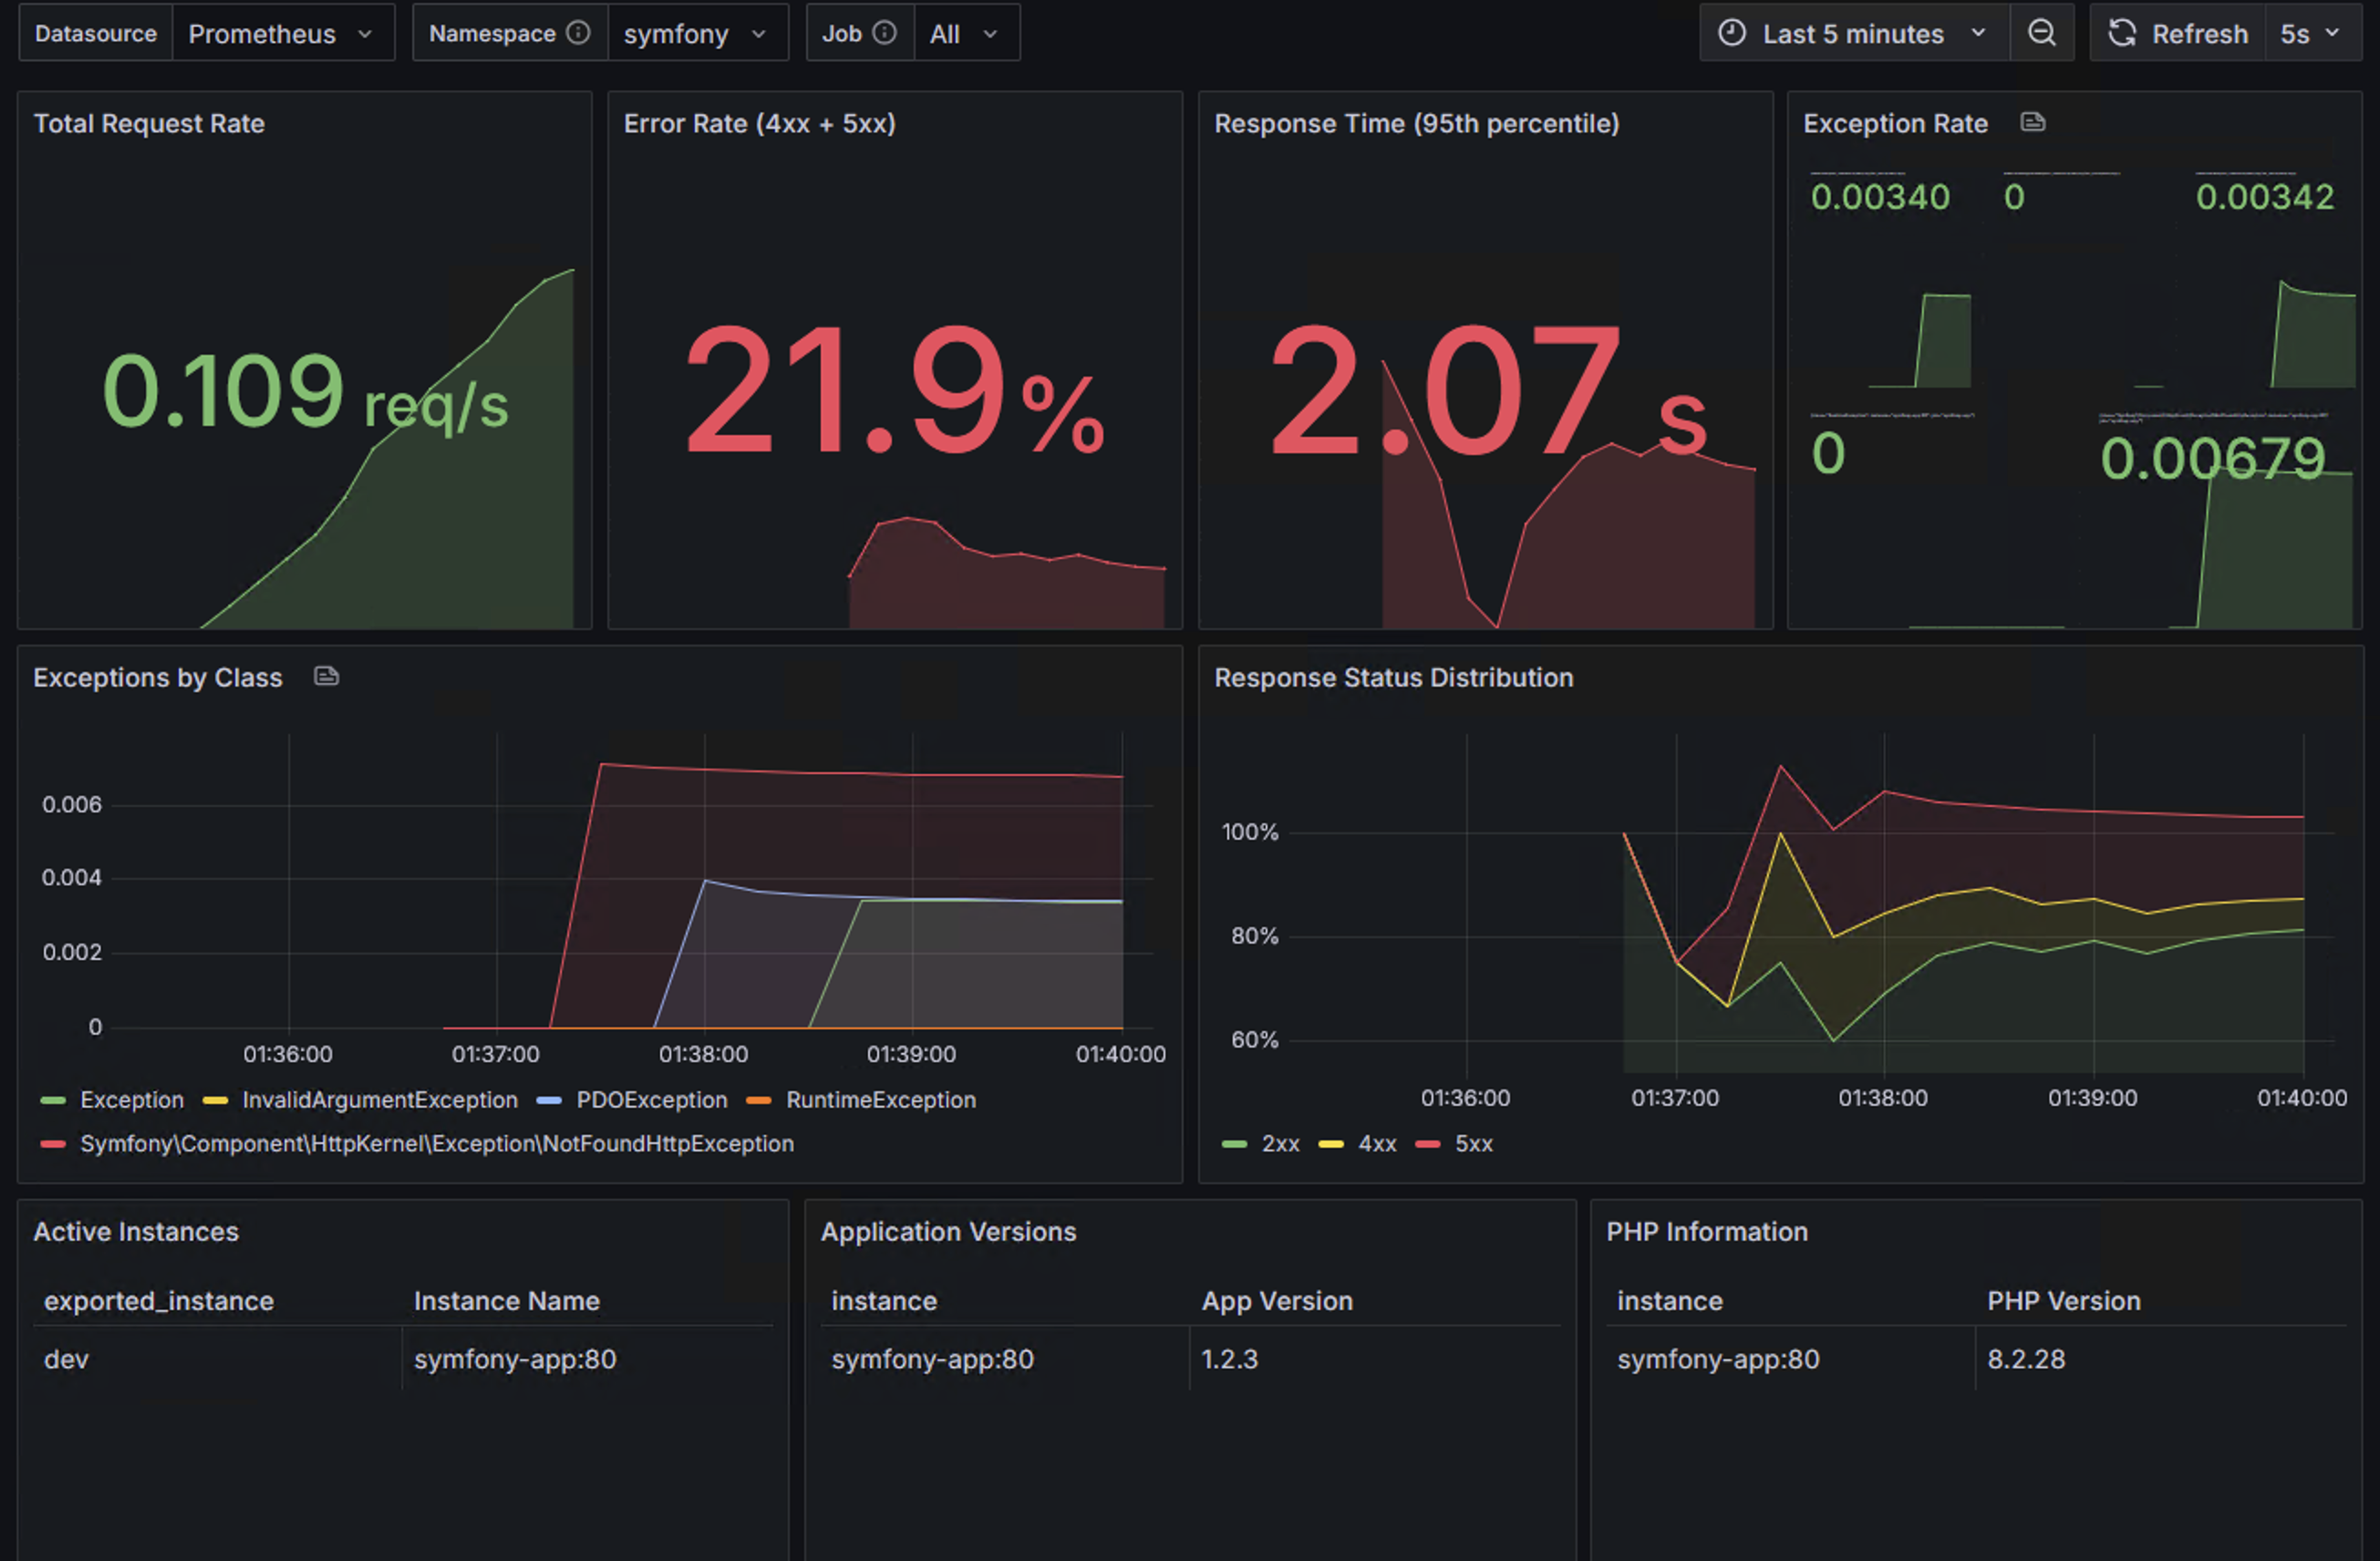
Example Grafana dashboards are provided in the grafana/ directory to help you visualize the metrics exposed by this bundle.
Available Dashboards
-
symfony-app-overview.json - Comprehensive application overview dashboard featuring:
- HTTP request rate and response status code distribution
- Response time percentiles and performance metrics
- Exception monitoring by class
- Application instance and version information
-
symfony-app-monitoring.json - Focused monitoring dashboard with:
- Key performance indicators (KPIs) at a glance
- Error rate tracking and alerting
- System health status overview
- Instance and PHP version information
Screenshots
See how the dashboards look with real data:
Symfony Application Overview Dashboard
Symfony Application Monitoring Dashboard
For more details about the screenshots and dashboard features, see the screenshots documentation.
Usage
- Import the JSON files into your Grafana instance via the dashboard import feature
- Configure your Prometheus data source to scrape metrics from your application's
/metrics/prometheusendpoint - Customize the
namespacetemplate variable to match your bundle configuration (default:symfony) - Select the appropriate
jobto filter metrics by your application instances
These dashboards are designed to work with the default metrics provided by the bundle and can be customized further based on your specific monitoring needs.
Verification
The dashboards have been validated and tested with a working demo environment. See the demo/ directory for:
- Validation scripts that verify dashboard structure and metric references
- Complete Docker-based demo stack with Symfony app, Prometheus, and Grafana
- Test scripts that demonstrate actual metrics generation
- Comprehensive verification documentation
Run php demo/validate-dashboards.php to validate the dashboard configurations.
Automated Integration Testing
This repository includes a GitHub Actions workflow that automatically:
- Sets up a complete integration environment with Symfony app, Prometheus, and Grafana
- Generates realistic test traffic to populate metrics
- Captures live screenshots of the Grafana dashboards with real data
- Makes the screenshots available as downloadable workflow artifacts
The integration workflow runs automatically on changes to the dashboard files and can also be triggered manually. You can download the latest dashboard screenshots from the GitHub Actions artifacts.
Contributors
| denisvmedia | Johnmeurt | rmbl | InboxViktorV | jb-reynaud | luca-nardelli |
| alshenetsky | edditor | marein | ctrl-f5 | ns3777k | scrutinizer-auto-fixer |
| Yozhef | karolmalinowski |
Code license
You are free to use the code in this repository under the terms of the MIT license. LICENSE contains a copy of this license.


