
tomvondracek / bolt-request-analytics

Cookieless, server-side visitor statistics for Bolt CMS 6, built only from the HTTP request: no JavaScript, no identifiers, no raw request storage.
Package info
github.com/Vondry/bolt-server-analytics
Type:bolt-extension
pkg:composer/tomvondracek/bolt-request-analytics
Fund package maintenance!
Requires
- php: >=8.2
- ext-json: *
- ext-mbstring: *
- symfony/cache: ^6.4 || ^7.0
- symfony/lock: ^6.4 || ^7.0
- symfony/polyfill-php84: ^1.43.0
- twig/twig: ^3.30
Requires (Dev)
- bolt/core: ^6.1.10
- phpstan/extension-installer: 1.4.3
- phpstan/phpstan: 2.3.4
- phpstan/phpstan-deprecation-rules: 2.0.5
- phpstan/phpstan-phpunit: 2.1.1
- phpstan/phpstan-strict-rules: 2.1.0
- phpunit/phpunit: ^11.5.58
- rector/rector: 2.8.3
- symplify/easy-coding-standard: ^13.3.23
Suggests
- ext-apcu: Keeps the throttle of logged failures in memory instead of in files
Provides
None
Conflicts
- bolt/core: <6.1 || >=7.0
Replaces
None
This package is auto-updated.
Last update: 2026-11-22 09:25:46 UTC
README
Cookieless, server-side visitor statistics for Bolt 6, built only from the HTTP request. No JavaScript on the public site, no cookies, no identifiers, no IP addresses, and the data never leaves your server.
- Pages: which pages are viewed, how often, in which languages, and where visitors go next
- Sources: search engines, AI assistants (ChatGPT, Perplexity, Claude, …), social networks, referrals, UTM campaigns, domain aliases and QR codes
- Visitors: devices, browsers, operating systems, preferred languages, busiest hours
- Problems: broken links (with the page that links to them), site searches, bot traffic by operator
- Insights: the few findings worth acting on, each with its likely cause and a next step
- A summary card on the dashboard and an Analytics page in the backend menu, for 7 days up to 3 years, compared with the period before or the year before
It deliberately never recognises a visitor, so there are no unique visitors, sessions, bounce rates or times on page. Pages are not slowed down: a request is classified only after its response has been sent.

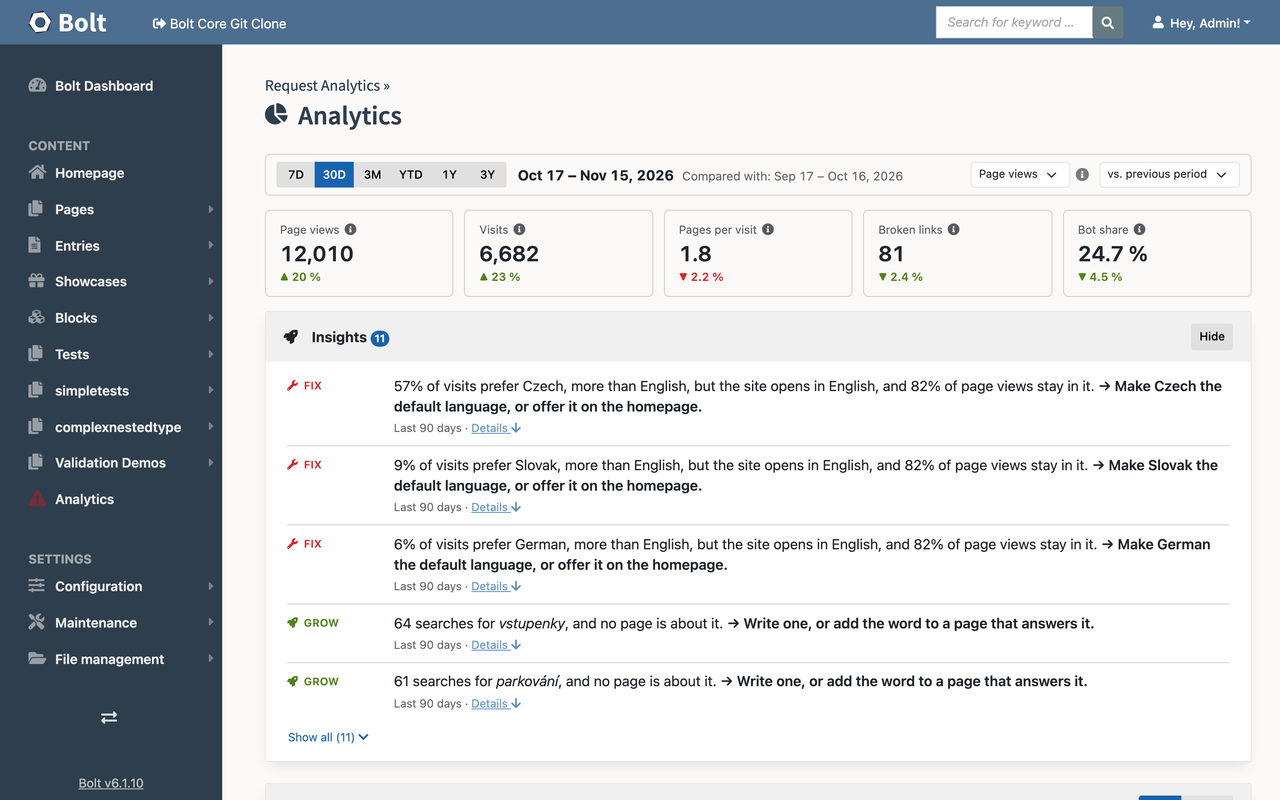
The dashboard card, and the Analytics page (watch a 12-second scroll through it).
Requirements
- Bolt CMS
^6.1, PHP>=8.2 - A SQLite file (default, needs
pdo_sqlite) or a MySQL / MariaDB / PostgreSQL database of its own
Installation
composer require tomvondracek/bolt-request-analytics
bin/console extensions:configure --with-config
bin/console cache:clear
extensions:configure copies the routes, the menu item and the translations into the project, and --with-config
the configuration to config/extensions/tomvondracek-requestanalytics.yaml. Run it again after every update.
The tables are created on first use and updated after an update. To do it right away, e.g. in a deploy script:
bin/console request-analytics:install
Database
The statistics always live in a database of their own, never in Bolt's, so the site never waits for them. By default
that is the SQLite file var/data/request-analytics.db. To use a server instead, create an empty database and point
the extension to it:
# config/extensions/tomvondracek-requestanalytics.yaml
storage:
  database: '%env(REQUEST_ANALYTICS_DATABASE_URL)%'
# .env.local
REQUEST_ANALYTICS_DATABASE_URL="mysql://stats:secret@127.0.0.1:3306/bolt_stats?serverVersion=8.0"
# or "postgresql://stats:secret@127.0.0.1:5432/bolt_stats?serverVersion=16"
- The database user needs
CREATE,ALTERandDROP: the extension manages its tables itself (no Doctrine migrations). - Bolt's own database is refused (the same SQLite file, or the same database on the same server).
- On MySQL / MariaDB the tables are always
utf8mb4/utf8mb4_bin, whatever the server's default. - Keep a SQLite file on local, persistent disk (not NFS), and include it in backups.
- When the database is unreachable, visits wait on disk (see How it works) and the dashboard card says what is wrong. Connecting gives up after 5 seconds, so the backend never hangs on it.
Production checklist
| What to check | |
|---|---|
| Access | Only ROLE_ADMIN (and ROLE_DEVELOPER) sees and deletes statistics by default. Change access.view / access.delete to open it to other roles. |
| Timezone | Days and hours follow timezone in config/bolt/config.yaml (Bolt's default is UTC). |
| Rollup | Nothing to set up on most hostings: a visit starts a rollup at most once an hour, after its page has been sent (PHP-FPM, LiteSpeed, FrankenPHP), and so does opening the dashboard. Under Apache mod_php or CGI, or on busy sites, add cron: 0 * * * * cd /path/to/project && bin/console request-analytics:rollup. A hosting whose cron can only call a URL (e.g. WEDOS): see Rollup URL. |
| File owners | The web server writes the spool and the SQLite file; cron reads and deletes them. Run cron as the web server's user, or put both in one group (files are created 0660, directories 0770). A file created by cron that the web server can't write is the most common reason the statistics stop. |
| Proxy / CDN | Configure framework.trusted_proxies. If the proxy passes on a different Host than visitors use, list the public hosts in own_hosts. |
| Deploys | With release directories (Deployer, Capistrano, …), add var/request-analytics/ and var/data/ to the shared directories, or waiting visits and the SQLite file are lost on every deploy. |
| Several web servers | Use a shared MySQL / PostgreSQL database. Each server has its own spool: visits roll up the spool of the server they reach; with cron, run it on every server. |
| Full-page cache | Pages served by a cache or CDN without reaching Bolt are not counted. |
| Privacy policy | Describe the processing (purpose, data, retention, GPC / DNT opt-out). Your web server's access log keeps IP addresses, User-Agents and full URLs (with search terms) on its own: set its retention too. Keep personal data out of URLs (names, e-mail addresses, tokens in GET forms). This is not legal advice. |
| Testing | Nothing is collected with APP_ENV=dev or APP_DEBUG=1. To test collection locally, use APP_ENV=prod APP_DEBUG=0 and clear the cache. |
Configuration
config/extensions/tomvondracek-requestanalytics.yaml (all keys optional; shown with their defaults):
enabled: true                    # false: collect nothing, hide the card and menu item

access:
  view: [ROLE_ADMIN]             # roles that see the statistics, e.g. [ROLE_ADMIN, ROLE_CHIEF_EDITOR]
  delete: [ROLE_ADMIN]           # roles that may delete them (also need a `view` role)

own_hosts: []                    # public hosts of the site, e.g. [example.com, www.example.com]

aliases:                         # see "Domain aliases"
  hosts: []                      # e.g. [example.org, poster-a2]
  target: ~                      # e.g. https://example.com (required with hosts)
  mode: count                    # count | tag
  redirect_status: 301           # 301 | 302 | 307 | 308
  param: ra_via                  # query marker in tag mode

exclude_paths: ['^/api(/|$)', '^/_', '^/theme/', '^/files/', '^/thumbs/', '\.(css|js|map|png|jpe?g|gif|webp|avif|svg|ico|woff2?|txt|xml)$']
route_templates: true            # /product/12345 is stored as /product/:id (also UUIDs, hashes, tokens)
search_params: [searchTerm, q, s, search]   # site-search parameters; terms are stored redacted
count_reloads: true

storage:
  database: '%kernel.project_dir%/var/data/request-analytics.db'   # SQLite path or mysql:// / postgresql:// URL

collector:
  spool_dir: '%kernel.project_dir%/var/request-analytics/spool'
  max_spool_mb: 1024             # stop collecting (and log) above this until the rollup catches up; 0 = no limit

aggregation:
  trigger: admin                 # admin (on dashboard visits) | cron | both; cron: never in a web request, also not on visits
  time_budget_ms: 1500           # per dashboard- or visit-triggered rollup
  chunk_size: 25000
  visit_interval_minutes: 60     # a visit starts a rollup at most this often, after its page was sent; 0 = never
  rollup_url: false              # false, or a path for a hosting's cron, e.g. /_request-analytics/rollup (see "Rollup URL")
  rollup_token: ~                # the secret the rollup URL needs, e.g. '%env(REQUEST_ANALYTICS_ROLLUP_TOKEN)%'

widget:
  target: dashboard_aside_top    # dashboard_aside_top | _middle | _bottom | dashboard_below_header | dashboard_bottom
  default_range: 30d             # Analytics page: 7d | 30d | 3m | ytd | 1y | 3y
  compare: previous              # previous | year | none
  metric: pageviews              # pageviews | entries (shown as "Visits")

privacy:
  honor_gpc: true                # Sec-GPC: 1
  honor_dnt: true                # DNT: 1
  opt_out_mode: minimal          # minimal (count the page only) | skip (store nothing)
  report_threshold_k: 5          # smaller counts are shown only as "Other"
  retention_months: 25           # detailed data; daily totals are kept. 0 = forever
  raw_max_days: 0                # 0 = visits wait for the rollup however long; N = deleted unread (and logged) after N days

debug:                           # see "Debugging the collection"
  dump: false                    # true: one line per request to var/log/request-analytics-debug.ndjson
  until: ~                       # required with dump: true, e.g. '2026-11-23 18:00' (site timezone, in quotes)
  max_mb: 20                     # the file stops growing at this size
- A
tomvondracek-requestanalytics_local.yamlnext to it overrides single values. - Relative paths are relative to the project directory. Paths in the public folder are refused.
- An invalid value is shown on the dashboard card and logged; the collector then pauses until it is fixed. An unknown key (likely a typo) is only reported.
How it works
 PUBLIC REQUEST                                   ADMIN
 Bolt sends the page                              Admin opens the dashboard (or cron, a visit, the rollup URL)
        │ kernel.terminate                               │
 classify the request                             rollup: spool ─► raw rows ─► daily aggregates
        │                                                │
 append one line to var/request-analytics/spool   Analytics page reads the aggregates
Collect. After the response is sent, the request becomes one row of derived values: day and hour, normalised path, device, browser and OS family, language, channel and source. The User-Agent and Referer are read but never stored; the IP address is never read. The row is appended to an hourly spool file, with no database connection (about 0.1 ms). Under PHP-FPM, FrankenPHP or LiteSpeed this happens after the connection is closed.
| Counted | Stored as |
|---|---|
A page opened in a browser (GET navigation, status 2xx or 304) |
page view with all dimensions |
| The same with status 404 | broken link: path and where the link was |
| A bot (bot-like User-Agent, a signed request, or headers that contradict it) | bot request: only the bot family |
| A request to a domain alias | alias hop: alias, path and source |
Not counted: the backend, AJAX and API calls, assets, prefetches, redirects, errors and exclude_paths. Visitors who
send GPC or DNT are counted without device, browser, source or language (or not at all with opt_out_mode: skip).
Not seen either: a page the browser had prefetched or prerendered and then shows (it asks the server only once, with
Sec-Purpose: prefetch, which is not counted), and a page restored from the back/forward cache. Sites that use
speculation rules, or a CDN feature that prefetches links, get fewer page views than a JavaScript counter would show.
Aggregate. The rollup moves spool lines into the database and rolls them into daily aggregate tables, within a time budget; a backlog is worked off over several runs. It is safe to stop at any point: no line is ever counted twice, also with several servers. Only one rollup runs at a time.
It runs when an administrator opens the dashboard, and on visits: at most every visit_interval_minutes (an hour), a
request starts one once its page has been sent, like WordPress's WP-Cron. That is only done where the page is out
before (PHP-FPM, LiteSpeed, FrankenPHP); under Apache mod_php or CGI the visitor would wait for it, so there it is
cron, the dashboard or the rollup URL. trigger: cron keeps every rollup out of web requests.
Rollup URL
For a hosting whose cron can only call a URL (WEDOS calls a URL once an hour), or a cron service on the web. Off by default. Create a secret and point the extension to it:
php -r 'echo bin2hex(random_bytes(24)), "\n";'
# config/extensions/tomvondracek-requestanalytics.yaml
aggregation:
  rollup_url: /_request-analytics/rollup
  rollup_token: '%env(REQUEST_ANALYTICS_ROLLUP_TOKEN)%'
# .env.local
REQUEST_ANALYTICS_ROLLUP_TOKEN=<the secret>
The cron then calls https://example.com/_request-analytics/rollup?token=<the secret> (GET or POST; the token may
also be sent as Authorization: Bearer <the secret>). The answer says how many rows were aggregated and how many
wait. Without the right token the request goes on as if the URL were not there (the site's own 404 page, or its page
of that path), so nobody can tell it exists. A rollup of the URL runs for up to 20 seconds, less where PHP's
max_execution_time is shorter. If the token's variable is not set or holds no usable secret, the dashboard card
says so and the URL answers no call; the statistics go on.
Failures never break a page. Any error (full disk, broken config, unreachable database) is logged at level error
to Bolt's log, at most once per 5 minutes. The spool is capped at max_spool_mb.
Debugging the collection
To find out why a request is counted the way it is, or not at all, switch on the debug dump for a while, best in
config/extensions/tomvondracek-requestanalytics_local.yaml (it takes effect without clearing the cache):
debug:
  dump: true
  until: '2026-11-23 18:00'      # required: the dump ends by itself
Each request of the site (not of the backend) is then appended to var/log/request-analytics-debug.ndjson, one JSON
line each:
{"at":"2026-11-21T19:30:12+01:00","method":"GET","url":"https://example.com/?utm_source=seznam&utm_medium=cpc","status":200,"zone":"frontend","headers":{"User-Agent":"Mozilla/5.0 …","Accept-Language":"cs-CZ,cs;q=0.9","Sec-Fetch-Mode":"navigate","…":"…"},"result":"pageview","collected":true,"reason":null,"hit":{"path":"/","channel":"paid_search","source":"seznam","…":"…"}}
result is what the request was counted as (pageview, not_found, bot, alias) or skipped, and reason says
why it was not counted (a prefetch, an excluded path, a redirect, not a page opened in a browser, …). It also works
with APP_ENV=dev, where nothing is collected: collected is then false and the reason says so.
The dump holds no secrets: only the headers the extension reads (never Cookie, Authorization, a CSRF token or an IP
address such as X-Forwarded-For); in the URL and the Referer, parameters named like a secret (token, password,
key, code, …), token-like path segments and e-mail addresses are masked (***, (redacted)); of a visitor who
sent GPC or DNT only the path, the signal and the decision. The dump stops at until or at max_mb, and the file is
deleted 7 days after its last line. It is still a record per request: switch it on only for as long as you need it.
The Analytics page
Two metrics run through the page:
- Page views: every page opened, including moves within the site.
- Visits: arrivals from outside (search, links, social, newsletters, typed addresses). Without cookies this is
the closest thing to visits. In the config and API it is called
entries.
A period bar (7D, 30D, 3M, YTD, 1Y, 3Y, or a drill-down into a week or month) sets the days of every card, with the comparison period and the metric. The choice is kept in the URL, so links can be shared.
| Card | Shows |
|---|---|
| Headline | Page views, visits, pages per visit, broken links and bot share, each with its change; a click jumps to the details |
| Insights | Findings worth acting on (below); hidden when there are none |
| Trend | Bars by day, week or month, with the comparison as a dashed line |
| Devices, browsers, OS | Shares and their change |
| When visitors come | Average page views per hour and weekday |
| Pages | Most or least viewed (including published pages nobody opened), languages per page, and each page's flow: where visitors came from and went next |
| Languages | Languages of the pages viewed vs. the languages visitors prefer, with gaps marked |
| Sources | Channels and sources with landing pages; UTM campaigns; aliases and QR codes. Empty tabs explain how to fill them |
| Broken links | Missing pages with where the links are, and what to do (fix the link, add a redirect) |
| Site search | What visitors searched for (e-mails, phone numbers and long numbers removed) |
| Bots | Bot share and bots by purpose and operator: search engines, AI crawlers, SEO tools, previews, monitoring, scripts, disguised browsers |
| Manage statistics | For access.delete: delete today, the last 7 / 30 / 90 / N days, or everything |
Values below report_threshold_k are shown as "Other", so a single figure does not single out one visitor. (Two
overlapping periods compared by hand can still show what one visit added; only those with access.view see them.) The page
shows what is aggregated, then starts a rollup and redraws; opening it never waits. It is translated into every
language of Bolt's backend; override texts with translations/request_analytics.<locale>.yaml in the project.
Insights
| Insight | Fires when |
|---|---|
| ⚙️ The numbers cannot be trusted | a day without page views after 14 busy ones; the site's own host counted as a referral; ≥ 30 % of visits without a referrer at < 1.1 pages per visit |
| 🔧 Broken links that lose visitors | a missing page linked from the site, or requested ≥ max(k, 10) times from elsewhere; suggests the page probably meant |
| 🔧 Where the lost visits went | visits fell ≥ 20 % (from ≥ 300), split by channel and landing page |
| 🔧 A browser or device stopped working well | its pages per visit fell ≥ 25 % while others changed < 10 % |
| 🚀 A language visitors want | ≥ 10 % and 100 visits ask for a language the site doesn't have |
| 🔧 A translation that doesn't reach its visitors | ≥ 5 % of visits prefer a site language that gets less than half that share of views |
| 🔧 / 🚀 Searched for, but not found | a term searched ≥ max(k, 20) times: 🔧 hard to find when a page has every word, 🚀 missing when none does |
| ⚖️ A translation nobody uses | < 1 % of page views and visits, from 1 000 page views |
Kinds: ⚙️ setup (comes first, and hides the insights that rely on the doubted data), 🔧 fix, 🚀 grow, ⚖️ decide. Changes compare the last 28 complete days with the 28 before; the rest uses the last 90 complete days. Today is never included. Insights resolve themselves when the numbers recover, so there is nothing to dismiss. They are computed on the server, at most once a day, and cached. With two or more fixes, the Analytics menu icon turns into a warning.
Deleting statistics removes every aggregate, raw row and spool file of the chosen days in one transaction, and logs who did it. Only whole days can be deleted. With several web servers, only the spool of the server handling the request is cleared. Backups are not affected.
Domain aliases
A redirect from a second domain (example.org → example.com) never shows up as a Referer, so the alias is counted on
the redirect itself:
| Mode | How | Needs |
|---|---|---|
count (default) |
The extension answers the alias host, counts the hop and redirects to target, keeping path and query |
The alias domain points to this application (with a certificate) and is allowed by framework.trusted_hosts |
tag |
Your registrar or web server redirects to target?ra_via=<alias>; the landing page carries the alias |
A redirect to a fixed URL |
aliases.hosts may also hold markers that are not hosts, e.g. poster-a2 for a QR code pointing to
https://example.com/?ra_via=poster-a2. Only listed markers are stored. Redirects are sent with
Cache-Control: no-store and always stay on target.
Security and privacy
- Access: only the roles of
access.view/access.delete, logged in as for the rest of Bolt's backend (also through "remember me"). Deleting needs a CSRF token of its own and a confirmation. Others see no menu item, card or page. - Endpoints: the page loads its numbers from backend-only endpoints that require the session, a CSRF token in a
header, and a same-origin request. Every response is
no-store, can't be framed, sniffed or embedded. - Rollup URL: off unless
rollup_urlis set (and withenabled: false); then only with its token (32+ characters of 10+ different ones, compared in constant time, never shown in a message), and it can do nothing but start a rollup. A token in the URL ends up in the web server's access log: keep the log private, or send the token in theAuthorizationheader. - Untrusted input: URLs, Referers, UTM values and search terms are normalised to safe whitelists before they are
stored (e.g.
/a/<script>is stored as/a/%3Cscript%3E), checked again when read from the spool, and escaped when shown. - Floods: made-up values (random missing pages, Referers, search terms) cannot fill the database: of a day with
more than 20 000 rows in one table, only the values seen at least
report_threshold_ktimes stay (those below are shown as "Other" anyway), so a flood never pushes the site's own values out. The daily totals stay exact. The User-Agent is classified in each process, with no shared cache anybody could fill. - Debug dump: off by default, ends by itself (
debug.until,debug.max_mb, deleted 7 days later), never holds a cookie, an IP address or a secret of the URL (see Debugging the collection). - At rest: files are owner-and-group only and never in the public folder. Deleted rows are overwritten
(
secure_delete);request-analytics:install --vacuumalso compacts an older SQLite file. - Stored: daily counters only, each dimension in a separate table, so no row describes a single visitor. Raw rows
(one per request, with its hour) wait for the next rollup, by default an hour at most (a visit starts one);
privacy.raw_max_daysdeletes those that wait longer, e.g. while the database is unreachable. No IP, identifier, raw header or exact time. E-mail addresses and phone numbers are removed from paths, search terms and UTM values; ids (5+ digits, UUIDs, hashes) in UTM values are stored as:id, as in paths. - Opt-out: GPC and DNT are honoured. A German court has held DNT to be a valid objection under the GDPR
(LG Berlin, 16 O 420/19):
opt_out_mode: minimalstill counts the page, without anything about the visitor;skipcounts nothing. - Disguised bots: a client claiming to be Chrome 90+ whose Client Hints or fetch headers contradict its
User-Agent is counted as a bot, and so is one claiming to be Firefox 90+ or Safari 16.4+ that sends neither fetch
metadata nor languages. One odd header alone never is. A Chromium whose Client Hints name
HeadlessChrome(Puppeteer, Playwright) is a bot whatever its User-Agent, and so is a request signed by its agent (Web Bot Auth), by operator where it is known.
Limitations
- No unique visitors, sessions, bounce rate or time on page (they need an identifier).
- No screen sizes, scroll depth or clicks (they need JavaScript).
- No countries (the IP address is never used) and no exact OS versions or device models (browsers freeze them).
- iPads count as macOS desktops: they send a Mac User-Agent.
- No page × device or page × language breakdowns: those dimensions are stored separately on purpose.
- A bot that imitates every header of a browser is counted as a visitor, and so are AI agents that drive the visitor's own browser (Perplexity Comet, Claude in Chrome): to the server they are that browser. Bots are told apart by what they send, never by IP address, so a client that calls itself Googlebot is counted as Googlebot.
- Pages shown from a prefetch, a prerender or the back/forward cache are not counted (see How it works).
- Numbers are as fresh as the last rollup.
Development
composer install
vendor/bin/phpunit                     # unit and security suites, on in-memory SQLite
vendor/bin/phpstan analyse --memory-limit=1G
vendor/bin/ecs check src tests
vendor/bin/rector process --dry-run
node .github/scripts/check-template-scripts.mjs
Database tests against a server:
docker run -d --rm --name ra-mysql -e MYSQL_ROOT_PASSWORD=ra -e MYSQL_DATABASE=ra -p 13306:3306 mysql:8.4
RA_TEST_DATABASE_URL='mysql://root:ra@127.0.0.1:13306/ra?serverVersion=8.4' vendor/bin/phpunit --group database
The security tests (tests/Security/) push the payloads of tests/Support/Payloads.php (XSS, template and SQL
injection, CRLF, path traversal, Unicode tricks, …) through every input the extension reads. CI runs everything on PHP
8.2 to 8.5 and against MySQL 8.4, MariaDB 11.4 and PostgreSQL 16, with at least 95 % line coverage.
To try a local checkout in a Bolt project:
composer config repositories.request-analytics '{"type":"path","url":"../bolt-server-analytics"}'
composer require tomvondracek/bolt-request-analytics:@dev
bin/console extensions:configure --with-config
License
MIT. Device, browser, OS and bot icons are from Font Awesome Free 5.15.4, CC BY 4.0.