
brocode / module-chartee

Module to generate Graphs and Charts with chart.js
Package info
github.com/brosenberger/module-chartee
Language:JavaScript
Type:magento2-module
pkg:composer/brocode/module-chartee
Fund package maintenance!
Requires
- league/csv: ^9.8
- magento/framework: *
Requires (Dev)
None
Suggests
None
Provides
None
Conflicts
None
Replaces
None
README
This module should ease the way of creating powerful charts in Magento 2. It is based on the chart.js library (which itself is already used by Magento2 for its dashboard charts) and various extensions for additional chart types.
Goals of this module:
- Be independent of the version management of Magento and updates of its library dependencies (only the current 2.4.7-beta2 uses chart.js v4.4.0!) and use newer chart.js versions in older Magento2 installations
- Provide a simple way to create charts in Magento2 without much knowledge of the chart.js library itself
- Provide boilerplate codes to easily integrate any type of chart in various places within Magento
- Encourage everyone to create meaningful representations of data already available in Magento2, no stackholder would see otherwise as it is buried in the databases
Installation
composer require brocode/module-chartee
bin/magento module:enable BroCode_Chartee
bin/magento setup:upgrade
Features
Supported chart types
Bar chart Based on the base implementation from https://www.chartjs3.com/docs/chart/getting-started/

Stacked bar chart
A bar chart variation with the help of the chart.js plugin https://github.com/y-takey/chartjs-plugin-stacked100/

Polar chart
A polar chart based on the sample from https://codepen.io/FranciscusAgnew/pen/LRGPYX

Doughnut chart
A variation of the base doughnut chart, based on https://www.youtube.com/watch?v=YcRj52VovYQ

Gauge chart
A variation of the doughnut chart, based on https://www.youtube.com/watch?v=VF6jd2Fv4bs&list=RDCMUCojXvfr41NqDxaPb9amu8-A&index=1

Boxplot chart
What is a Boxplot chart? See Wikipedia for more information.
A boxplot chart, based on https://www.youtube.com/watch?v=2zEbeX0bPS8

Geo choropleth chart
A world map coloured by a value per country, based on the chart.js plugin https://github.com/sgratzl/chartjs-chart-geo/ and the sample from https://codepen.io/sgratzl/pen/bGVmQKw
Extend \BroCode\Chartee\Model\DataBuilder\GeoChoroplethChartDataBuilder, set the topology and add one data entry per country, referencing the country by its name or its numeric ISO 3166 id. The browser resolves the references against the topology; entries without a matching country are dropped. The bundled countries-50m topology is registered in \BroCode\Chartee\Model\Data\GeoCode\CompositeGeoCodeJsonService (etc/di.xml), further topologies can be added there.
$this->setTopology('countries-50m', 'countries')
    ->createDataSet()
        ->setLabel(__('Orders'))
        ->setDataValues(['feature' => 'Austria', 'value' => 42], ['feature' => '276', 'value' => 17])
        ->build();

Ready to use charts
Customer Group Distribution
The charts shows the distribution of registered customers between all customer groups. It also provides the possibility to download the shown data as CSV.
The chart follows the customer group grid below it: filtering, searching or paging the grid restricts the chart to the customer groups currently listed, and the percentages are recalculated for those groups. The CSV download always contains all customer groups.
It can be found in the page Customers -> Customer Groups:

Permissions: only admin users with the permission BroCode_Chartee::chart_customer_group_distribution can see the chart.

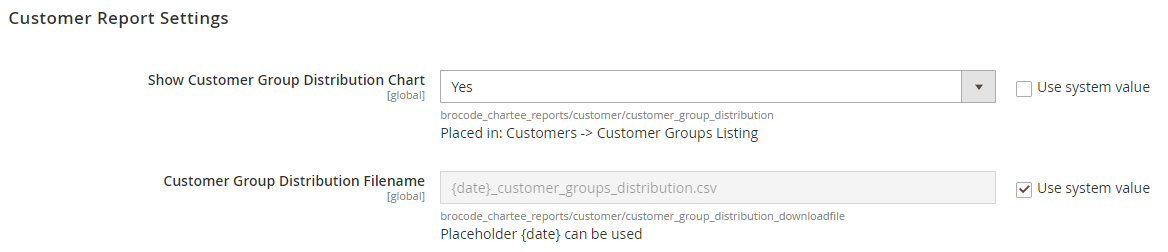
Configuration: Stores -> Configuration -> Services -> Chartee Reports Configuration -> Customer Report Settings
- the chart is disabled by default and can be enabled via configuration
- the download filename can be changed via configuration

Adminhtml menu items
All menus can be found under Content -> BroCode Chartee

Chartbuilder Listing
Shows all registered chart builders.

Currently no further features are implemented. Possible features could be:
- Preview of generated chart.js configurations (TBD)
Demo Charts
Listing of all current demo charts and links how they have been implemented on js side.
Boilerplate code snipptes
ColumnBaseChart
Simple base class to order all added subblocks in a column layout. It dynamically sets the according needed columns, based if a chart is shown or not (which can change based on configuration or permissions). Additionally a section title added.
Sample of a row with 2 columns and a section title:
<block name="dashboard.chart.row.1" class="BroCode\Chartee\Block\ColumnBaseChart">
    <action method="setData">
        <argument name="name" xsi:type="string">section_title</argument>
        <argument name="value" xsi:type="string">First Section Title</argument>
    </action>
    <block name="dashboard.chart.row.1.chart.1" ...>...</block>
    <block name="dashboard.chart.row.1.chart.2" ...>...</block>
</block>
BaseCompositeChart
Base chart display class. It can be used within the frontend and adminhtml (a specialized subclass exists with the extension of checking backend permissions: BroCode\Chartee\Block\Adminhtml\BaseCompositeChartsBlock). It provides the following features:
- checks the visibility based on a configuration value
- adds the possibility to prepare a download link of the shown data (or more) as CSV file
- the download file name can be configured (otherwise it will be autogenerated as {current-date}_{md5-hash}.csv)
- the key to the data from the chartbuilder that should be downloadable
- checks the visibility based on a ACL permission (only the adminhtml-class)
<block name="brocode.customer.customergroup.distribution.chart" template="BroCode_Chartee::customer/customer_group_distribution.phtml" class="BroCode\Chartee\Block\Adminhtml\BaseCompositeChartsBlock">
    <action method="setData">
        <argument name="name" xsi:type="string">visibilityConfigPath</argument>
        <argument name="value" xsi:type="string">brocode_chartee_reports/customer/customer_group_distribution</argument>
    </action>
    <action method="setData">
        <argument name="name" xsi:type="string">permission</argument>
        <argument name="value" xsi:type="string">BroCode_Chartee::chart_customer_group_distribution</argument>
    </action>
    <action method="setData">
        <argument name="name" xsi:type="string">chartDataBuilder</argument>
        <argument name="value" xsi:type="string">brocode-customer-stacked-group</argument>
    </action>
    <action method="setData">
        <argument name="name" xsi:type="string">downloadNameConfigPath</argument>
        <argument name="value" xsi:type="string">brocode_chartee_reports/customer/customer_group_distribution_downloadfile</argument>
    </action>
    <action method="setData">
        <argument name="name" xsi:type="string">downloadDataKey</argument>
        <argument name="value" xsi:type="string">customer_groups_data</argument>
    </action>
</block>
Chart Data Builder
Every chart needs a datasource, which is an implementation of \BroCode\Chartee\Api\ChartDataBuilderInterface. For every base chart a separate Databuilder is already implemented with default configurations for that type of chart and possibly additional methods for creating the needed configuration.
Every base chart has its default DataBuilder and an implementation example within \BroCode\Chartee\Model\DataBuilder\Demo.
Implementation of a new Databuilder
Extend the needed specific ChartDataBuilder, here a Sample of the DemoPolarChartDataBuilder:
class DemoPolarChartDataBuilder extends PolarChartDataBuilder
{
    public function build()
    {
        $this->setDataLabels(['Mon', 'Tue', 'Wed', 'Thu', 'Fri', 'Sat', 'Sun'])
            ->createDataSet()
                ->setLabel('Weekly Sales')
                ->setDataValues(12, 19, 3, 17, 28, 24, 7)
                ->setBackgroundColors("#2ecc71", "#3498db", "#95a5a6", "#9b59b6", "#f1c40f", "#e74c3c", "#34495e")
                ->build();

        return parent::build();
    }
}
To add downloadable data to be used, any data must be set separatelly to the chart builder class:
public function build()
{
    ...
    $this->setData('customer_groups_data', $groupData);
    ...
    return parent::build();
}
Registration within the databuilder service
The databuilder needs to be registered within a di.xml in order to use it as named builder within the Template-block class:
<?xml version="1.0"?>
<config xmlns:xsi="http://www.w3.org/2001/XMLSchema-instance"
        xsi:noNamespaceSchemaLocation="urn:magento:framework:ObjectManager/etc/config.xsd">

    <type name="\BroCode\Chartee\Model\ChartDataService">
        <arguments>
            <argument name="chartDataBuilders" xsi:type="array">
                <item name="brocode-customer-stacked-group" xsi:type="object">\BroCode\Chartee\Model\DataBuilder\Customer\StackedCustomerGroupDataBuilder</item>
            </argument>
        </arguments>
    </type>
</config>
Datafiltering
the \BroCode\Chartee\Model\ChartRequestParameterService provides methods to gather all set filtering parameter that should be considered when building up the needed data.
Current following parameters are supported:
- Scope (ChartRequestParameterService::getStoreIds(), based on the backend store switcher Magento\Backend\Block\Store\Switcher)
- DateRange (ChartRequestParameterService::getStartDate() & ChartRequestParameterService::getEndDate(), null if not set)
Hint for adding a store filter to your backend page:
<?xml version="1.0"?>
<page xmlns:xsi="http://www.w3.org/2001/XMLSchema-instance"
      xsi:noNamespaceSchemaLocation="urn:magento:framework:View/Layout/etc/page_configuration.xsd">

<body>
    <referenceContainer name="page.main.actions">
        <block class="Magento\Backend\Block\Store\Switcher" name="store_switcher" as="store_switcher" template="Magento_Backend::store/switcher.phtml">
            <action method="setUseConfirm">
                <argument name="params" xsi:type="string">0</argument>
            </action>
            <action method="setSwitchWebsites">
                <argument name="params" xsi:type="string">1</argument>
            </action>
            <action method="setSwitchStoreGroups">
                <argument name="params" xsi:type="string">1</argument>
            </action>
        </block>
    </referenceContainer>
</body>
Hint for adding a date range filter to your backend page:
<?xml version="1.0"?>
<page xmlns:xsi="http://www.w3.org/2001/XMLSchema-instance"
xsi:noNamespaceSchemaLocation="urn:magento:framework:View/Layout/etc/page_configuration.xsd">

    <body>
        <referenceContainer name="page.main.actions">
            <block class="BroCode\Chartee\Block\Filter\DateRangePicker" name="date_range_picker" />
        </referenceContainer>
    </body>
</page>
Hint for using a date range picker in a custom element:
<input type="text" name="daterange" value="" data-mage-init='{"date-range-picker": {}}'/>
Hint for configuration possibility (see https://www.daterangepicker.com/#config), e.g. hiding the week numbers:
<input type="text" name="daterange" value="" data-mage-init='{"date-range-picker": {"showWeekNumbers":false}}'/>
Filtering datasets on the client
The graph widget offers filterDataSets(key, values), which shows only the datasets whose property key is contained in values (null shows all) and redraws the chart. Any extra property set on a dataset in the databuilder can be used as key, e.g.:
$this->createDataSet()
    ->setLabel($group['group_name'])
    ->setDataValues($group['count'])
    ->setData('groupId', (int)$group['group_id'])
    ->build();
$('canvas').graph('filterDataSets', 'groupId', ['1', '3']);
The customer group distribution chart uses this in BroCode_Chartee/js/customer-group-chart-filter, which listens to the data of the customer group grid provider (customer_group_listing.customer_group_listing_data_source).
BroCode\Chartee\Block\Widget\BaseChart
These charts are used by the BaseCompositeChart class and can also be used as standalone charts too. The according demo page charts are implemented that way.
Steps to add a new chart:
- create a databuilder (see above)
- create a virtual type and define a specific view model for that databuilder
<virtualType name="BroCode\Chartee\Block\ViewModel\DemoBoxplotChartConfiguration" type="BroCode\Chartee\Block\ViewModel\BaseChartDataViewModel">
    <arguments>
        <argument name="dataBuilder" xsi:type="object">BroCode\Chartee\Model\DataBuilder\Demo\DemoBoxplotDataBuilder</argument>
    </arguments>
</virtualType>
- create a layout update and set a the defined view model
<block class="BroCode\Chartee\Block\Widget\BaseChart" name="chartee.boxplot.demo.chart">
    <action method="setViewModel">
        <argument name="viewModel" xsi:type="object">
            BroCode\Chartee\Block\ViewModel\DemoBoxplotChartConfiguration
        </argument>
    </action>
</block>
JS-Libraries, Chart.js version and extensions
- chart.js v4.4.0
- chart.js helpers (parts of it) v4.3.2
- chart.js boxplot plugin v4.2.4
- chart.js geo plugin v4.2.8 (AMD wrapper adapted to use the helpers of the bundled chart.js)
- chart.js stacked100 plugin v1.5.2
- chart.js autocolors plugin 0.2.2
- custom implementation (based on samples from the internet, see above for reference) within graph.js
- doughnut labels line plugin
- gauge chart
- JQuery daterangepicker extension https://github.com/dangrossman/daterangepicker
More Magento modules and write-ups: brocode.at